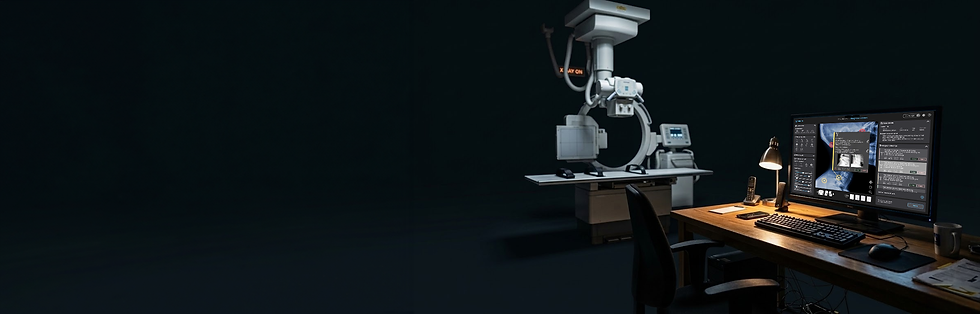
AI assisted radiology analysis design POC


01
About the project
Sibirica is a Design concept and a UX POC for an AI assisted radiology analysis software.
This concept has been designed for final usability testing sessions, before venturing out
to a new company business path
My role
Field research
Workflows mapping
Wireframes
High fidelity mockups
Visual design
Usability testings
Challenges
Combine the AI tools when needed without them interfering or taking over, while making them intuitive
and easy to use.
Design the application’s workflow to suit the existing user’s workflows,
and introducing new ways
to be more efficient.
Designing the interface to display
large amounts of visual info while keeping it tidy and clear.
Objectives
Incorporating AI as a workflow augmentation tool.
Designing the app to work both in automated flow, while keeping the ability to still edit and work manually.
Having the app making most of the administrative duties towards writing the report.
02
Research
I’ve held 15 interviews with end users together with the product manager,
we held 19 surveys to gather information, and read several articles describing the workflow, procedures and regulations for radiologists.
We also benchmarked several of the current softwares that are deployed today.
Intakes
- Most facilities currently are not using digital tools, not to mention AI powered ones.
- Image processing tools needed to enhance and highlight different tissues and areas.
- Marking, measuring and drawing tools are a must.
- Radiologists work mostly in dark environments, ‘dark mode’ themed application is preferred.
-AI can make the initial diagnosis, but the user will check and make the actual final calls.
- Patient cases hold multiple angles of the same injury, users need to compare the different angles simultaneously
03
Defining the project roadmap
Using the conclusions from the research phase, we framed the main user workflows and began to build the high level project roadmap and the basic application infrastructure.
Key workflow checkpoints-
- Referring physician ask for patient's imaging
- Xray technician take the images
- Radiologist diagnoses the images according to the referring physician's notes and forms a diagnosis report
- Repot goes back to the referring physician to conclude the needed patient treatment
User workflow mapping
The application outputs a set of suggested findings, guiding the radiologist to points of interest and assisting them in generating a diagnostic report, here's how

Main screens mapping


04
Lo-Fi wireframes
Task library screen
As the first step of the workflow
the Radiologist can browse, edit and choose a task to diagnose
I chose to present the tasks in cards display to make it easy for the user to browse through, by showing minimal info while keeping it highly visual.
On the right-side user have the selected task preview with its full info.

Diagnosis screen
The main work area to diagnose
the tasks images. Displaying the AI generated issues for the radiologist
to examine and work towards issuing
the summary diagnostic report

This screen need to contain a lot of text and visuals.
To be kept tidy and clutter free,
it's designed with a strict grid to hold all items.
The general composition designed to have the left vertical strip as the tools area, and the right strip to contain the data.
The middle part kept as the work canvas.
Detailed design
05
After testing the the lo-fi wireframes with several users and making some adjustments to them,
we moved on to create the hi-fi designed screen for the final user validation sessions
Intakes
- Users ask for as many tools to show on screen at all times. they can handle the clutter.
- Users make their prognosis very quickly, they need the AI to help them on specific points and areas.
- Having a clear view for conclusions as POI is a game changer for them.
Image diagnosis flow
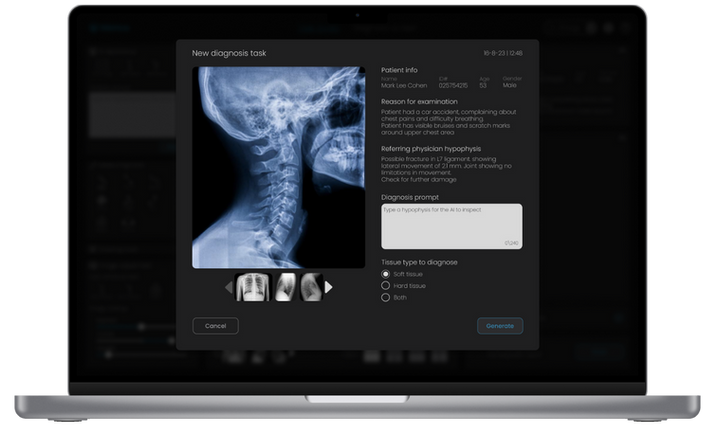
1. New diagnosis task wizard
After a task has been chosen, A wizard to set the task details popup to guides the user to type-in a prompt, according to the referring doctor’s hypophysis.
The prompt generates a preliminary AI diagnosis.
2. Diagnosis screen
After the preliminary AI diagnosis is done, the user is directed to the main diagnosis screen.
There he is presented with the AI generated diagnosed issues in their minimized card state.
Cards showing basic essential data, including issue severity, description and basic relevant values.

3. Issue editing and validate

The user can click on issues from the ‘Diagnosis findings’ list or hover over the issues pin marks to expand the full diagnosis details.
Here he can also edit and add to the diagnosis summary text.
From this popup and from the minimized issue cards the user can choose to accept or reject an issue.
4. AI assisted selection diagnosis

Users can voluntarily diagnose a suspicious area and add issues to the list.
Using the selection tools,
Users select an area.
A ‘diagnose selection’ dialog pops-up next to the selected area, asking the user to write a prompt for the AI to inspect.
Users can add issue manually
after clicking the ‘+’ icon at the bottom of the list using the drawing, measuring and text tools.
When finished, the user presses ‘Done’ and a ‘Diagnosis report’ dialog will show, with a premade report containing the accepted issues, for the user to finish editing and close the task.

08
Results
After validating the concept with several users in deferent sites,
we developed a preliminary working concept and deployed it in some of our costumers labs for a field experiment with very good results.
The company is now developing the algorithms on which the machine learning process will be based on- The first step in building the new product.
88% positive purchase intent
Users are keen to try the new product,
and waiting for it to be launched
33% reduction of diagnosis time
Preliminary concept had proved a massive reduction in end-to-end case diagnosis time
25% increase in diagnosis accuracy
First deployed working concepts show a great increase in case diagnosis accuracy in comparison to their current diagnosis tools and methods